
View Log Information
System logs allow you to collect platform-level information about installed/registered components. Log information includes date/time, machine name, environment, component, type, and event status in a grid format. When the log row is clicked, detailed error information appears, if any. It is necessary to define your existing Elasticsearch endpoint in order to use the optional System Monitoring function. To learn more about this procedure, see Define Elasticsearch Endpoint.
Complete the following steps to view log information.
- Click the Settings icon
 in the top-right corner of the screen. The Settings icon is a global button that displays in every module of the OPEN DISCOVERY platform.
 -
The System Manager opens. In the left pane of the System Manager, click System Logs.


- Select a report type from drop-down menu.
- Select a date range by using the supplied calendar fields.
- To search for specific information in the logs grid, enter a search term in the search field. The grid will reflect the search criteria. To clear the search field, click
 .
. - Click
 to export the logs to a .CSV file.
 -
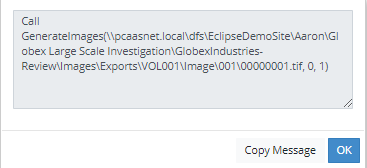
To copy the Event column contents to the clipboard, click the desired log record to display the pop up Message dialog as shown in the following figure.

Click Copy Message to select the event text in the Message dialog. Paste the event text to the desired destination such as a text editor. Click OK to close the Message dialog when finished.
Related Topics